

Design · Lifetime deal
Infography
AI tool that turns blog posts and data into infographics, with templates and a brand kit.
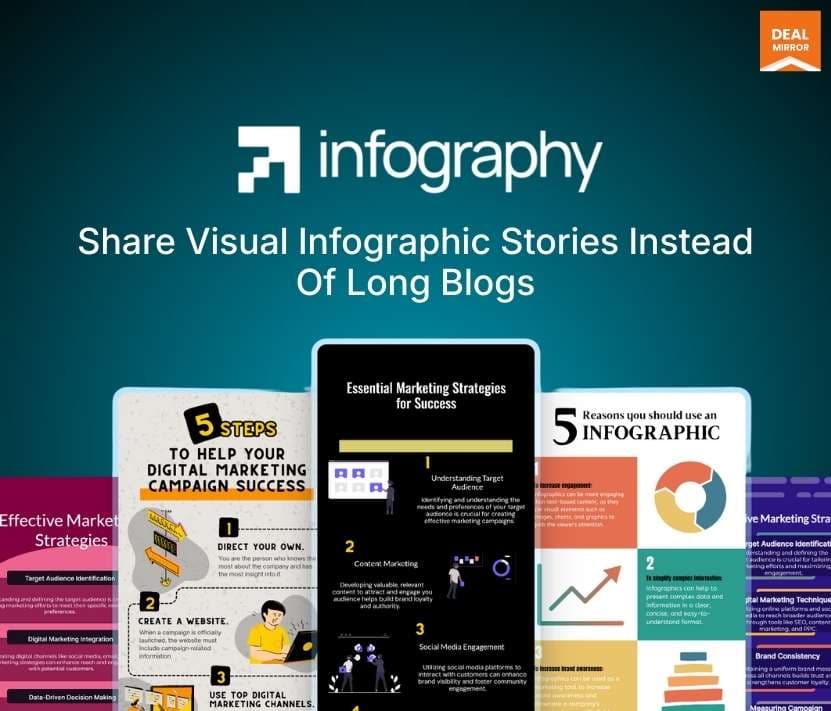
Infography at a glance
- Platform
- Web
- Support
- Email support, with priority email on Tier 2.
Our take
Is Infography worth buying?
Based on the DealMirror listing, Infography is a credit-limited AI infographic maker. Tier 2 adds credits, users and priority support. Credits reset monthly, so match the tier to how many graphics you make.
Good fit if
- You turn blog posts into graphics regularly.
- You want templates and a brand kit without a designer.
- You can work within monthly AI credits.
Skip it if
- You need full manual design control.
- You need a mobile app now.
- You expect unlimited generation.
Which Infography plan do you need?
Prices in USD, excluding tax.
| Tier 1 | Tier 2 | |
|---|---|---|
| One-time price | $29 | $87 |
| Regular price (DealMirror) | ||
| You save | $69 | $111 |
| AI credits per month | 50 | 250 |
| Users | 1 | Up to 5 |
| Support | Priority email | |
| Languages | 100+ | 100+ |
Before you buy: DealMirror's terms and extra costs
- Refund. 30 day money-back guarantee, or 60 days for DealMirror Prime members, per the listing.
- Redeem. Redeem your code within 60 days of purchase.
- AI usage cost. Output uses monthly AI credits that reset each month. The listing says the tool runs on Google's Gemini 2.5 Flash Lite, which may change.
- Support. Email support, with priority email on Tier 2.
- Platform. Web based. A mobile app is listed as coming soon for Tier 2.
What is Infography?
Infography is a web-based AI tool that turns blog posts, topics or text into infographics. It offers templates for social posts, ads, posters, resumes and reports, AI layout and color suggestions, a brand kit and high-resolution export. The deal is a lifetime license sold through DealMirror, with two tiers that differ by monthly AI credits and users.
What Infography says it does
- Turns blog posts, topics or text into infographics with AI
- Brand kit for logo, fonts and colors
- Supports 100+ languages
- High-resolution export for print, web or social
Why Infography
It saves rebuilding a blog post in a design tool by generating a first layout. Output depends on a monthly credit pool, and a mobile app is listed only as upcoming.
How does Infography work?
Redeem the code
Redeem your DealMirror code within 60 days of purchase.
Add your content
Paste a blog post, topic or data.
Generate
The AI builds an infographic layout from your content.
Brand it
Apply your logo, fonts and colors from the brand kit.
Export
Download the design in high resolution.
Then it handles:
- Infographics from blog posts
- Social posts, ads and posters
- Reports and resumes
- Brand consistent designs
- Team comments on projects
- High resolution export
Who is Infography for?
Built for
- Bloggers and marketers who publish often
- Small teams without a designer
- Anyone producing graphics in many languages
Not for
- Designers who need full manual design control
- Heavy users who would exceed the monthly credit pool
- Buyers who need a mobile app today
What is included in Infography?
Create
- AI infographic generation from posts, topics or text
- Templates social, ads, posters, reports
- AI design suggestions layout and color
- 100+ languages
Brand and share
- Brand kit logo, fonts and colors
- Custom branding
- Team collaboration up to 5 users on Tier 2
- High resolution export
Video review
We have not reviewed Infography on video yet.
Get notifiedBuyer reviews
No reviews yet. Bought Infography? Add it to your workspace and share what it replaced.
Add to your workspaceInfography questions
What is Infography?
An AI tool that turns blog posts, topics or text into infographics, with templates, a brand kit and high resolution export.
How do credits work?
Tier 1 has 50 AI credits per month, about 25 to 250 infographics per the listing. Tier 2 has 250 credits, about 125 to 1,250.
Can I use a team?
Tier 2 allows up to 5 users. Tier 1 listing does not mention extra users.
Is there a mobile app?
The listing shows a mobile app as coming soon for Tier 2.
What is the refund policy?
30 days for regular buyers and 60 days for DealMirror Prime members. Redeem the code within 60 days.
Can I stack codes?
The listing does not mention stacking.
Often compared with
These are other tools in the same space, not deals on GrabLTD.
- Canva
- Visme
- Piktochart
- Venngage
- Adobe Express
Sources
Checked . Prices and terms on this page come from: